ProtScale - Documentation
- The following is an excerpt from the chapter:
-
Protein Identification and Analysis Tools on the Expasy Server;
Gasteiger E., Hoogland C., Gattiker A., Duvaud S., Wilkins M.R., Appel R.D., Bairoch A.;
(In) John M. Walker (ed): The Proteomics Protocols Handbook, Humana Press (2005).
pp. 571-607
Full text - Copyright Humana Press.
Using ProtScale
ProtScale allows to compute and represent (in the form of a two-dimensional plot) the profile produced by any amino acid scale on a selected protein.
An amino acid scale is defined by a numerical value assigned to each type of amino acid. The most frequently used scales are hydropathicity scales, most of which were derived from experimental studies on partitioning of peptides in apolar and polar solvents, with the goal of predicting membrane-spanning segments that are highly hydrophobic, and secondary structure conformational parameter scales. In addition, many other scales exist which are based on different chemical and physical properties of the amino acids.
ProtScale can be used with 50 predefined scales entered from the literature. The scale values for the 20 amino acids, as well as a literature reference, are provided on Expasy for each of these scales. To generate data for a plot, the protein sequence is scanned with a sliding window of a given size. At each position, the mean scale value of the amino acids within the window is calculated, and that value is plotted for the midpoint of the window.
You can set several parameters that control the computation of a scale profile, such as the window size, the weight variation model, the window edge relative weight value, and scale normalization.
Window size
The window size is the length of the interval to use for the profile computation, i.e. the number of amino acids examined at a time to determine a point of hydrophobic character. When computing the score for a given residue i, the amino acids in an interval of the chosen length, centered around residue i, are considered. In other words, for a window size n, we use the i - (n-1)/2 neighboring residues on each side of residue i to compute the score for residue i. The score for residue i is the sum of the scale values for these amino acids, optionally weighted according to their position in the window. One should choose a window that corresponds to the expected size of the structural motif under investigation: A window size of 5 to 7 is appropriate for finding hydrophilic regions that are likely to be exposed on the surface and may potentially be antigenic. Window sizes of 19 or 21 will make hydrophobic, membrane-spanning domains stand out rather clearly (typically > 1.6 on the Kyte & Doolittle scale (7)).
Relative weight of the window edges
The central amino acid of the window always has a weight of 100%. By default, the amino acids at the remaining window positions have the same weight, but you can attribute a larger weight (in comparison to the other residues) to the residue at the center of the window by setting the weight value for the residues at the extremities of the interval to a value between 0 and 100%. The decrease in weight between the center and the edges will either be linear or exponential, depending on the setting of the weight variation model option.
Weight variation model
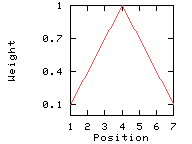
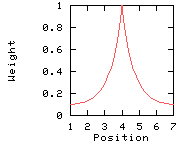
In the following example, the window size is 7, and the window edge relative weight value is 10%.
-
Linear weight variation model
-
This option divides the weight into equally spaced intervals between 100% and the window edge relative weight (here: 10%).

Weights used for the computation of the score for residue  i:

(window size 7, weight at window edges 10%)


residue number		i-3	i-2	i-1	  i	i+1	i+2	i+3

window position		 1	 2	 3	  4	 5	 6	 7

---------------------------------------------------------------------------

weight			10%	40%	70%	100%	70%	40%	10%
-
Exponential weight variation model
-
This option makes the weights decrease exponentially from the central position to the window edge. This parameter has an effect only if you set the window edge relative weight to a value other than 100%.

Weights used for the computation of the score for residue  i:

(window size 7, weight at window edges 10%)


residue number		i-3	i-2	i-1	  i	i+1	i+2	i+3

window position		 1	 2	 3	  4	 5	 6	 7

---------------------------------------------------------------------------

weight			10%	12%	39%	100%	39%	12%	10%
Scale normalization
You can choose whether to use the unmodified selected scale values from the literature or to normalize the values so that they all fit into the range from 0 to 1. Normalization is useful if you want to compare the results of profiles obtained with different scales, and makes plots with a more uniform appearance.
Interpreting results
The method of sliding windows, and hence ProtScale, only provides a raw signal and does not include interpretation of the results in terms of a score. When interpreting the results, one should only consider strong signals. In order to confirm a possible interpretation, one could slightly change the window size, or replace the scale by another similar one (e.g. two different hydropathicity scales), and ensure that the strong signal is still present.
