pROC: display and analyze ROC curves in R and S+
pROC is a set of tools to visualize, smooth and compare receiver operating characteristic (ROC curves). (Partial) area under the curve (AUC) can be compared with statistical tests based on U-statistics or bootstrap. Confidence intervals can be computed for (p)AUC or ROC curves.
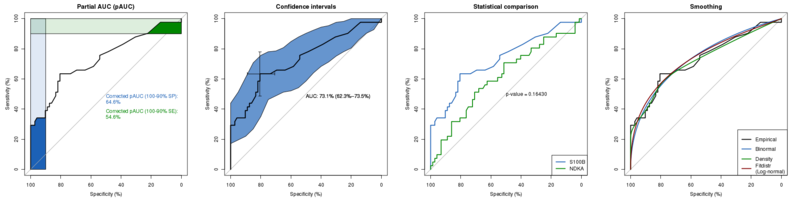
More screenshots and examples…
If you use pROC in published research, please cite the following paper:
Xavier Robin, Natacha Turck, Alexandre Hainard, Natalia Tiberti, Frédérique Lisacek, Jean-Charles Sanchez and Markus Müller (2011). pROC: an open-source package for R and S+ to analyze and compare ROC curves. BMC Bioinformatics, 12, p. 77. DOI: 10.1186/1471-2105-12-77.- Authors
- Xavier Robin, Natacha Turck, Alexandre Hainard, Natalia Tiberti, Frédérique Lisacek, Jean-Charles Sanchez and Markus Müller
- Contact
- Xavier Robin
- License
- GPLv3
Find us on:


pROC comes in two flavours: a command line version for the R statistical software environment, and a graphical user
interface (GUI) for S+.
R |
S+ |
|---|---|
|
This version is intended to be employed through the R command line.
InstallationThere is no need to download the package. The installation can be done in one command directly from R: install.packages("pROC")
The package must then be loaded with: library(pROC) To get help, enter the following in the R prompt: ?pROC UpdateAny of the following commands will update pROC if possible: install.packages("pROC")
update.packages() # will install updates to all your packages |
This version is intended to be employed with the TIBCO Spotfire S+ program. It has a graphical user interface (GUI) for S+ 8.2 32bits for Windows, but the command line is also available.
Deprecation warningThe S+ version is not developed any longer (due to diverging code bases and apparent drop of support of S+ by TIBCO) but still contains the latest main features of pROC (especially power tests). The GUI is available only on the 32 bits version of S+ 8.2 for Windows (no Linux / Mac / 64 bits support). InstallationIn the S+ command prompt (in Windows, you can open it from S+ Window menu, Commands Window item), type:
install.pkgutils() Save the installation file (binary for Windows, source for Linux) in your working directory and then type: install.packages("pROC_1.4.9_S_WIN386.zip") # Or for the source version:
After loading from the File menu, item Load Library…, a new
ROC curves menu is available in the Statistics menu. You can
also load it with the command
library(pROC) More details about installation… UpdateRepeat the installation steps described above, except the install.pkgutils() command.
More details about update… |
Versions
- 1.7.2 (2014-04-05) (R, release notes)
-
Fixed bug where
ci.coordswithx="best"would fail if one or more resampled ROC curve had multiple "best" thresholds (thanks Berend Terluin for the report) -
Fixed bug in
ci.coords: passing more than one value inxnow works -
Fixed typo in documentation of
directionargument toroc(thanks Le Kang for the report) - Add a warning when computing statistics of ROC curve with AUC = 1
- Require latest version of Rcpp to avoid weird errors (thanks Tom Liptrot for the report)
- 1.7.1 (2014-02-20) (R, release notes)
- Close SOCK cluster on Windows with parallel=TRUE
- Fixed really use algorithm 1 when microbenchmark fails
- 1.7 (2014-02-19) (R, release notes)
-
Faster algorithm for DeLong
roc.test,power.roc.test,ci.auc,varandcovfunction (no large matrix allocation) -
Handling Math and Operations correctly on
aucandciobjects (see?groupGeneric.pROC) -
The
formulaforroc.formulacan now provide several predictors and a list of ROC curves will be returned -
Fixed documentation of
ci.coordswith examples - Fixed binormal AUC computed with triangulation despite the claim in the documentation
- Fixed unstated requirement on Rcpp >= 0.10.5
- 1.6.0.1 (2013-12-28) (R, release notes)
- Removed erroneous error message displayed when predictors and responses were not vectors.
- 1.6 (2013-12-26) (R, release notes)
-
New
power.roc.testfunction for sample size and power computations. -
New
covandvarfunctions supports new"obuchowski"method. -
New
ci.coordsfunction to compute CI of arbitrary coords. -
coordsaccepts newretvalue "1-accuracy". -
Introducing various algorithms to compute sensitivities and specificites, with a more vectorized code or Rcpp. See 'algorithm' in
?rocfor more details on the trade-offs of the different methods. -
Faster algorithm for DeLong
roc.test,ci,varand cov function (thanks Kazuki Yoshida). -
are.pairednow also checks for identicallevels. - Fixed a warning generated in the examples.
-
Fixed several bugs related with
smooth.roccurves. - Additional input data sanity checks.
- Now requires R ≥ 2.13 (in fact, since 1.5.1, thanks Emmanuel Curis for the report).
-
Progress bars now defaults to text on Macs where
tcltkseems broken (thanks Gerard Smits for the report). - 1.5.4 (2012-08-31) (R)
- Running less smooth.roc examples with logcondens because they take too much time (requested by Uwe Ligges).
- 1.5.3 (2011-08-31) (R, release notes)
-
AUC specification was lost when
roc.test,covorvarwas passed anauc' object. -
Correct computation of "accuracy" in
coords(thanks to Kosuke Yoshihara for the report). - 1.5.1 (2011-03-09) (R, release notes)
- Faster loading of the package (thanks to Prof Brian Ripley and Glenn Lawyer for the report).
- 1.5 (2011-12-12) (R, release notes)
-
New
covandvarfunctions. -
coordsaccepts newretvalues: "accuracy", "tn", "tp", "fn", "fp", "npv", "ppv", "1-specificity", "1-sensitivity", "1-npv", "1-ppv", "npe" and "ppe". -
New
legacy.axesargument toplot1-specificity rather than specificity. -
New
axesargument to turn off the plotting of the axis. -
New
logcondensandlogcondens.smooth(Univariate Log-Concave Density Estimation) smoothing methods. -
New function
has.partial.aucto determine if an AUC is full or partial. -
New argument
dropforcoords. -
aucandmulticlass.aucobjects now also have secondary classnumeric. - Updated load call.
-
Delong's CI reversed in ROC curves with
direction=">". - Delong's CI AUC returned values > 1 or < 0 in some rare cases.
- Minor improvements in documentation.
- 1.4.9 (2014-01-04) (S+ only, release notes)
- This is the last version of pROC for S+. It introduces some features of pROC 1.5 (covariance and variance functions, some bugfixes) and 1.6 (power tests) for R into S+, and will not be maintained any more.
- Fixed custom output report.
-
New
power.roc.testfunction for sample size and power computations. -
New
covandvarfunctions. -
aucobjects now also have secondary classnumeric. -
Delong's CI reversed in ROC curves with
direction=">" - Delong's CI AUC returned values > 1 or < 0 in some rare cases
- Delong's CI AUC returned NA values when AUC was 1. Now reporting 1-1 interval.
- Minor improvements in documentation.
- 1.4.4 (2011-08-10) (R, S+, release notes)
- Fixed alternative for one-tailed tests.
- Removed COPYING file to fix a warning in r-devel.
- 1.4.3 (2011-03-18) (R, S+, release notes)
- Updated citation.
- 1.4.2 (2011-03-03) (R, S+, release notes)
-
Fixed bootstrap
roc.testgenerating NAs whensmooth.rocs were used withreuse.auc=FALSE(thanks to Buddy for the report). -
Documented a warning that was missing in
roc.test. - Updated citation.
- 1.4.1 (2011-01-27) (R, S+, release notes)
- Venkatraman's test for unpaired ROC curves.
- 1.4 (2011-01-21) (R, S+, release notes)
-
'smooth' does not apply on
orderedfactors anymore. - Multi-class AUC support (R only).
-
Can choose how
bestthresold is determined (best.methodandbest.weightsincoordsandprint.thres.best.methodandprint.thres.best.weightsinplot.roc). -
Minor fixes in documentation (R and S+) and
citation(S+ only). -
printnow prints the response instead of response and more informative data inhtests. -
Bootstrap with
ci.aucconsumes much less memory. - Unpaired bootstrap and DeLong's test.
-
Specificity and sensitivity tests (in
roc.test). - 1.3.2 (2010-08-24) (R, S+, release notes)
-
print.aucprinted incorrect CI inplot.roc(thanks to Alexander B. Leichtle for the report). -
Failed to detect local maximas in
coordswhen 2 or less points were selected. - Don't consider ROC extremities (+-Inf at 1.0/0.0 SE<->SP) as local maximas.
- 1.3.1 (2010-08-18) (R, release notes)
- Sensitivity and specificity were inverted in coords when results were reported as list.
-
Faster checks with
\dontrun{}inroc.test. - 1.3 (2010-08-13) (R, S+, release notes)
-
CI is not re-computed by default in
smooth.roc. You can still turn it on withreuse.ci=TRUE. -
New function
are.paired. -
Local maximas could be incorrectly detected in
coords(andplot.roc) withpredictors containing more than 2 levels. -
New method
venkatramanforroc.test. - MASS and tcltk packages are now only suggested instead of required (R only).
-
...not passed correctly inplot.ci.sewithtype="bars"resulting in an error (R only). - 1.2.1 (2010-05-11) (R, S+, release notes)
-
Handle
methodarguments forsmooth.rocandci.aucseparately inroc.default(R-only). -
Added
auc.polygon.*andmax.auc.polygon.*arguments forpolygoninplot.roc. - 1.2 (2010-05-09) (R, release notes)
-
Added DeLong method in
ci.auc(with a GUI, S+ only). -
Return value of ci.auc does not contain an
"aucs"item anymore. -
Put most examples with bootstrap within
\dontrun{}blocks for faster (but less useful) checks execution. - 1.1 (2010-05-05) (R, S+, release notes)
-
Added
lines.rocfunctions for ROC. -
Added
typeargument for bothlines.rocandplot.roc. -
Added
print.auc.colargument toplot.roc. -
Fixed a warning in
roc.test.defaultwhen the class ofpredictor1had several elements. - Fixed an encoding failure during the checks on MacOS X (R only).
- 1.0.1 (2010-04-28) (R, release notes)
-
Reduced examples execution time. Added low
boot.nin the slowest examples andreuse.aucandreuse.ciarguments insmooth.roc.roc. - 1.0 (2010-04-27) (R, S+, release notes)
- First public release.
Known bugs
Please report any bug you may encounter to Xavier Robin.
References
- James Carpenter and John Bithell (2000) “Bootstrap condence intervals: when, which, what? A practical guide for medical statisticians”. Statistics in Medicine 19, 1141–1164. DOI: 10.1002/(SICI)1097-0258(20000515)19:9<1141::AID-SIM479>3.0.CO;2-F; PMID: 10797513.
- Elisabeth R. DeLong, David M. DeLong and Daniel L. Clarke-Pearson (1988) “Comparing the areas under two or more correlated receiver operating characteristic curves: a nonparametric approach”. Biometrics 44, 837–845. JSTOR: 2531595; PMID: 3203132.
- Lutz Duembgen, Kaspar Rufibach (2011) “logcondens: Computations Related to Univariate Log-Concave Density Estimation”. Journal of Statistical Software, 39, 1–28. URL: jstatsoft.org/v39/i06.
- Tom Fawcett (2006) “An introduction to ROC analysis”. Pattern Recognition Letters 27, 861–874. DOI: j.patrec.2005.10.010.
- James E. Hanley (1988) “The robustness of the “binormal” assumptions used in fitting ROC curves”. Medical Decision Making 8, 197–203. DOI: 10.1177/0272989X8800800308; PMID: 3398748.
- Donna Katzman McClish (1989) “Analyzing a Portion of the ROC Curve”. Medical Decision Making 9, 190–195. DOI: 10.1177/0272989X8900900307; PMID: 2668680.
- Nancy A. Obuchowski and Donna K. McClish (1997) “Sample size determination for diagnostic accurary studies involving binormal ROC curve indices”. Statistics in Medicine, 16, 1529–1542. DOI: 10.1002/(SICI)1097-0258(19970715)16:13<1529::AID-SIM565>3.0.CO;2-H.
- Nancy A. Obuchowski, Micharl L. Lieber and Frank H. Wians Jr. (2004) “ROC Curves in Clinical Chemistry: Uses, Misuses, and Possible Solutions”. Clinical Chemistry, 50, 1118–1125. DOI: 10.1373/clinchem.2004.031823.
- Margaret Pepe, Gary Longton and Holly Janes (2009) “Estimation and Comparison of Receiver Operating Characteristic Curves”. The Stata journal 9, 1. PMID: 20161343.
- Xavier Robin, Natacha Turck et al. (2011) “pROC: an open-source package for R and S+ to analyze and compare ROC curves”. BMC Bioinformatics, 12, 77. DOI: 10.1186/1471-2105-12-77.
- E. S. Venkatraman and Colin B. Begg (1996) “A distribution-free procedure for comparing receiver operating characteristic curves from a paired experiment”. Biometrika 83, 835–848. DOI: 10.1093/biomet/83.4.835
- E. S. Venkatraman (2000) “A Permutation Test to Compare Receiver Operating Characteristic Curves”. Biometrics 56, 1134–1138. DOI: 10.1111/j.0006-341X.2000.01134.x.
- Kelly H. Zou, W. J. Hall and David E. Shapiro (1997) “Smooth non-parametric receiver operating characteristic (ROC) curves for continuous diagnostic tests”. Statistics in Medicine 18, 2143–2156. DOI: 10.1002/(SICI)1097-0258(19971015)16:19<2143::AID-SIM655>3.0.CO;2-3; PMID: 9330425 .